Interactive Dashboards
Custom interactive financial dashboards for US businesses — real-time KPIs, cash position, and automated reporting.
Duration
2-4 weeks
Pricing
Custom
Best For
Interactive finance dashboards
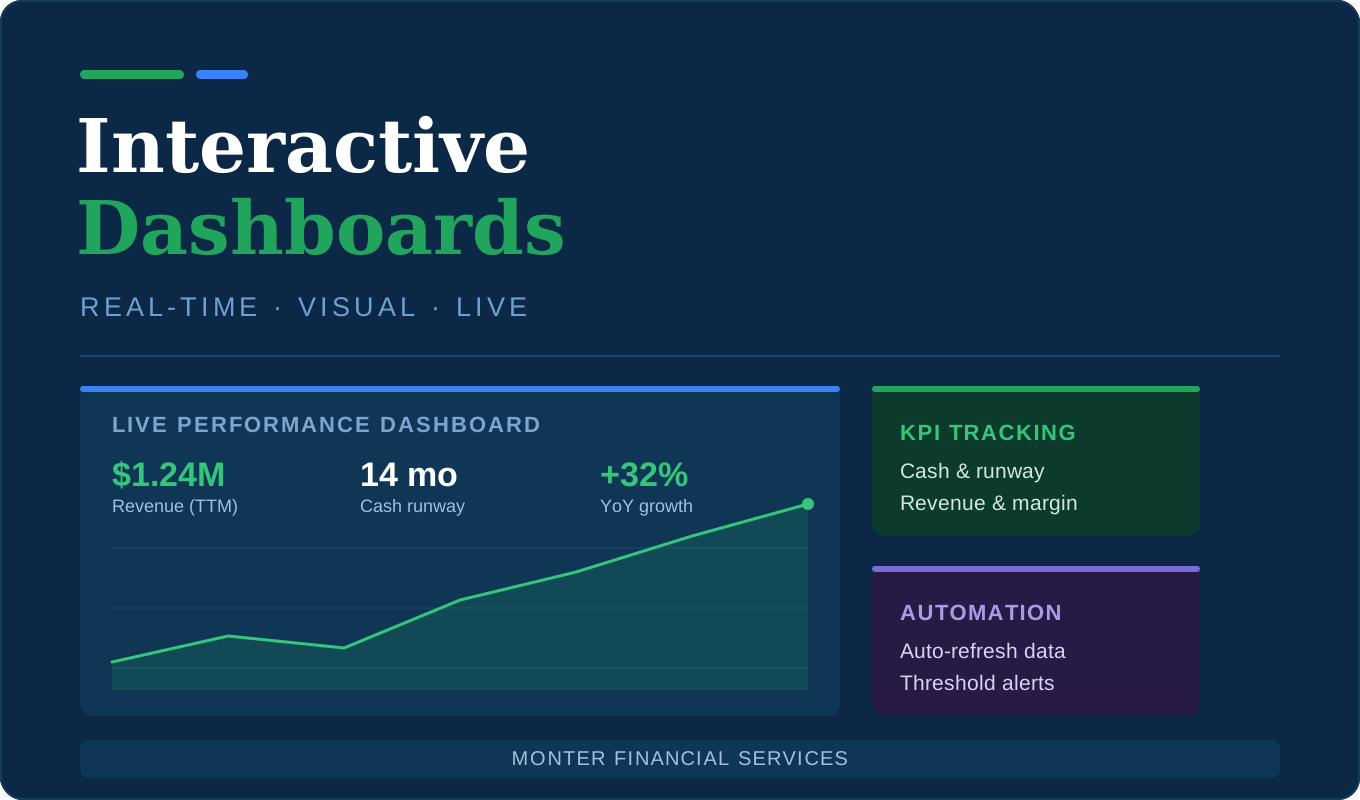
Interactive Financial Dashboards for Smarter US Business Decisions
Stop waiting for monthly reports to understand your business. At Monter Financial, we design and build custom interactive financial dashboards that give your leadership team real-time visibility into the KPIs, cash position, and controls that matter — so every meeting starts with the right numbers.
Get a Free Consultation · Book a Strategy Call
What We Track
What Our Dashboards Cover
Every dashboard is custom-built around your business model — but these are the core areas we bring to life:
- ✓ Accuracy and consistency of your financial statements — live, not lagged
- ✓ Compliance with applicable accounting standards and internal policies
- ✓ Key internal controls around revenue recognition, expenses, and cash management
- ✓ Fraud and error risk indicators tracked across financial records
- ✓ Operational efficiency metrics — revenue per FTE, overhead ratios, margin trends
- ✓ Cash position and runway updated in real time
- ✓ KPI goal tracking with visual progress against targets
- ✓ Automated reporting views for investors and internal stakeholders
Our Approach
How We Build Your Dashboard
We perform analytical procedures, define the metrics that matter for your stage, and design a dashboard your leadership team will actually use — not just a showcase that gets ignored.
Our work follows professional review standards for financial accuracy and results in clear, practical dashboards paired with recommendations. Every metric shown has a reason to be there — and every anomaly surfaces an action.
KPI Discovery
We define which metrics actually matter for your stage, business model, and decision-making — cutting out noise.
Data Source Mapping
We connect your accounting software, billing platform, CRM, and other data sources into a single source of truth.
Dashboard Design
We design an intuitive layout with clear visualizations — built for fast comprehension, not data overwhelm.
Deploy & Train
We deploy the dashboard, train your team to use it, and set up alert thresholds for metrics that need watching.
Not sure if your business needs a dashboard or a deeper financial review? Read: Important Signs Your Business Needs Professional Accounting Help
Key Deliverables
What You Receive
📊 Live Financial Dashboard
A custom, interactive dashboard your whole team can access — updated automatically from your connected data sources.
📋 KPI Framework
A documented KPI framework defining each metric, its source, calculation method, and target — so nothing is ambiguous.
🔔 Alert & Threshold Setup
Automated alerts when key metrics cross thresholds — so you're notified of issues before they become crises.
📬 Management Letter
A summary of control weaknesses and improvement opportunities identified during the dashboard build and data review.
🎯 Prioritized Action Plan
Quick wins and longer-term improvements ranked by impact — so you know exactly where to focus first.
🔧 Ongoing Support
Follow-up support to help you implement improvements, add new metrics, and keep the dashboard evolving with your business.
Tools & Integrations
Platforms We Build On
We work with the tools your team already uses or will realistically adopt:
- Google Looker Studio
- Microsoft Power BI
- Google Sheets
- Excel
- QuickBooks
- Xero
- Stripe
- HubSpot
- Salesforce
Ideal Clients
Who This Service Is For
Perfect for US businesses that need faster, clearer financial visibility without hiring a data engineering team:
- Businesses needing comfort for lenders or investors through consistent, real-time reporting
- Companies scaling quickly that want to tighten controls and KPI tracking before issues appear
- Founders who want an independent, CFO-level view of their finance function at a glance
- Leadership teams that spend too long preparing board reports and want to automate the process
If you're not sure whether you need a dashboard, a financial review, or both — we can help you choose the right level of visibility for your stage and goals.
Turn Your Financial Data Into a Real-Time Decision Engine
Let's build a dashboard that makes every board meeting, investor update, and leadership session faster and more confident.
Frequently Asked Questions
What's Included
Ready to Get Started?
Let's discuss how our interactive dashboards service can help your business grow and succeed.